Human skull shape evolved faster than any of the apes
New research led by Aida Gómez-Robles helps illustrate how researchers study the evolution of cranial form.
My students have begun to anticipate that almost every time I look at their data, I’m going to ask to see a tree.
Similarity in biology is shaped by phylogenetic relationship—a pattern summarized by the tree of common biological ancestry. In my work I’m often trying to understand why fossils are different from each other. The first question I ask is whether the differences I see are more or less than what their places on the tree should make me expect.
In practice this is not always so easy with fossils. But a good grounding in the tree of relationships of living species can help a lot.
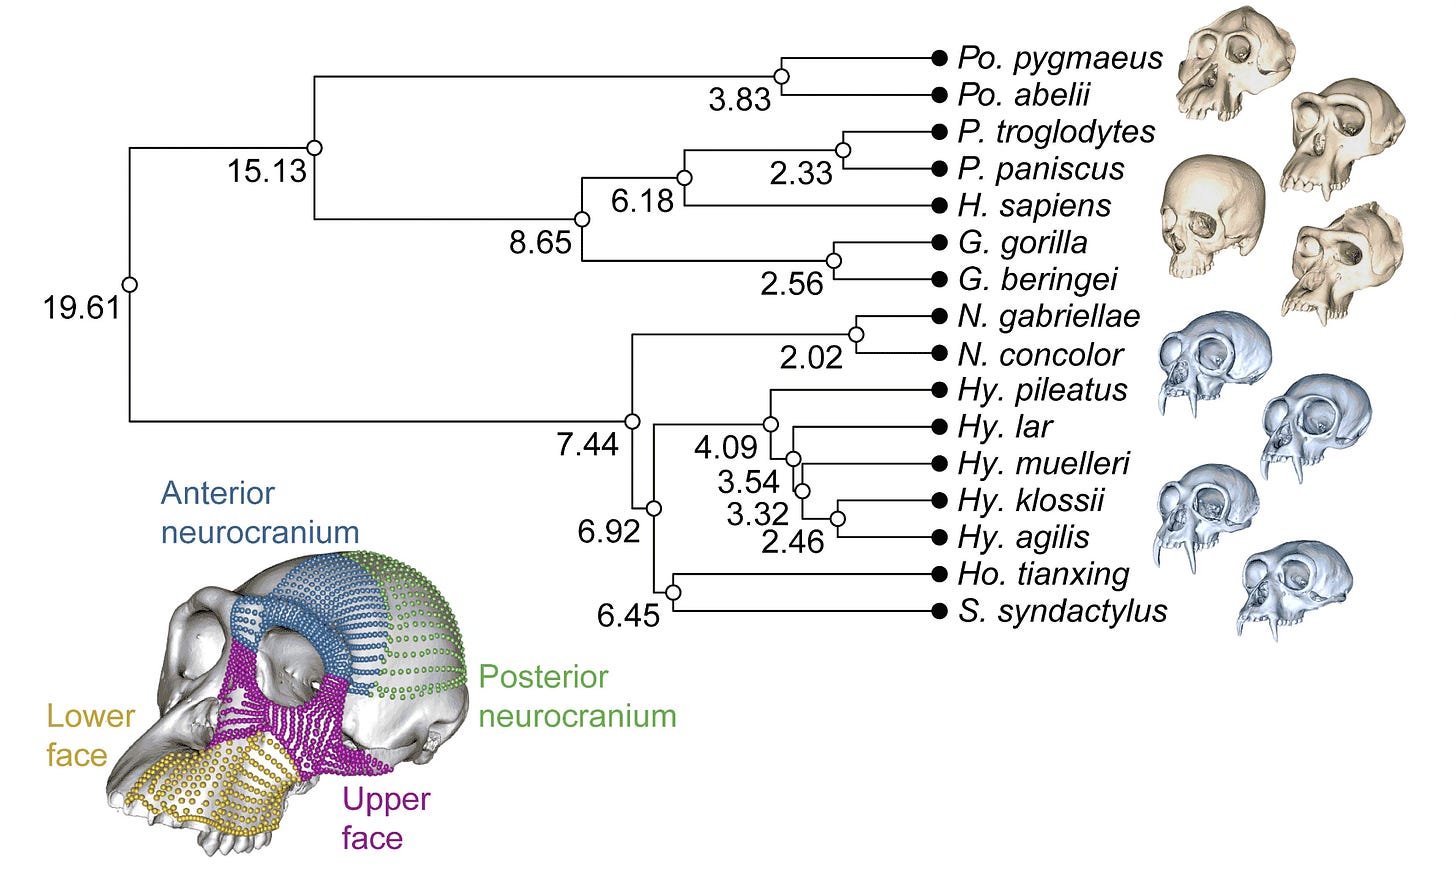
A recent study by Gómez-Robles and collaborators provides some great examples of this. The team considered the evolution of skull shape in the ancestry of 16 species of hominoids, including humans, great apes, and gibbons. The study helps illustrate how a study of anatomical shape variation can be put into the context of a phylogenetic tree.
What they found was that humans evolved in cranial shape very fast relative to other kinds of apes. That observation has a lot of importance in how we think about the shape variation of our fossil relatives.
High-dimensional, highly correlated
A common way for researchers to study anatomical variation is to collect hundreds of two- or three-dimensional points—usually called landmarks—on skulls, teeth, or other bones of a sample of individuals. Many, many landmarks are recorded for each individual, the position of each indicated on two or three axes, making for a dataset that may have thousands of dimensions.
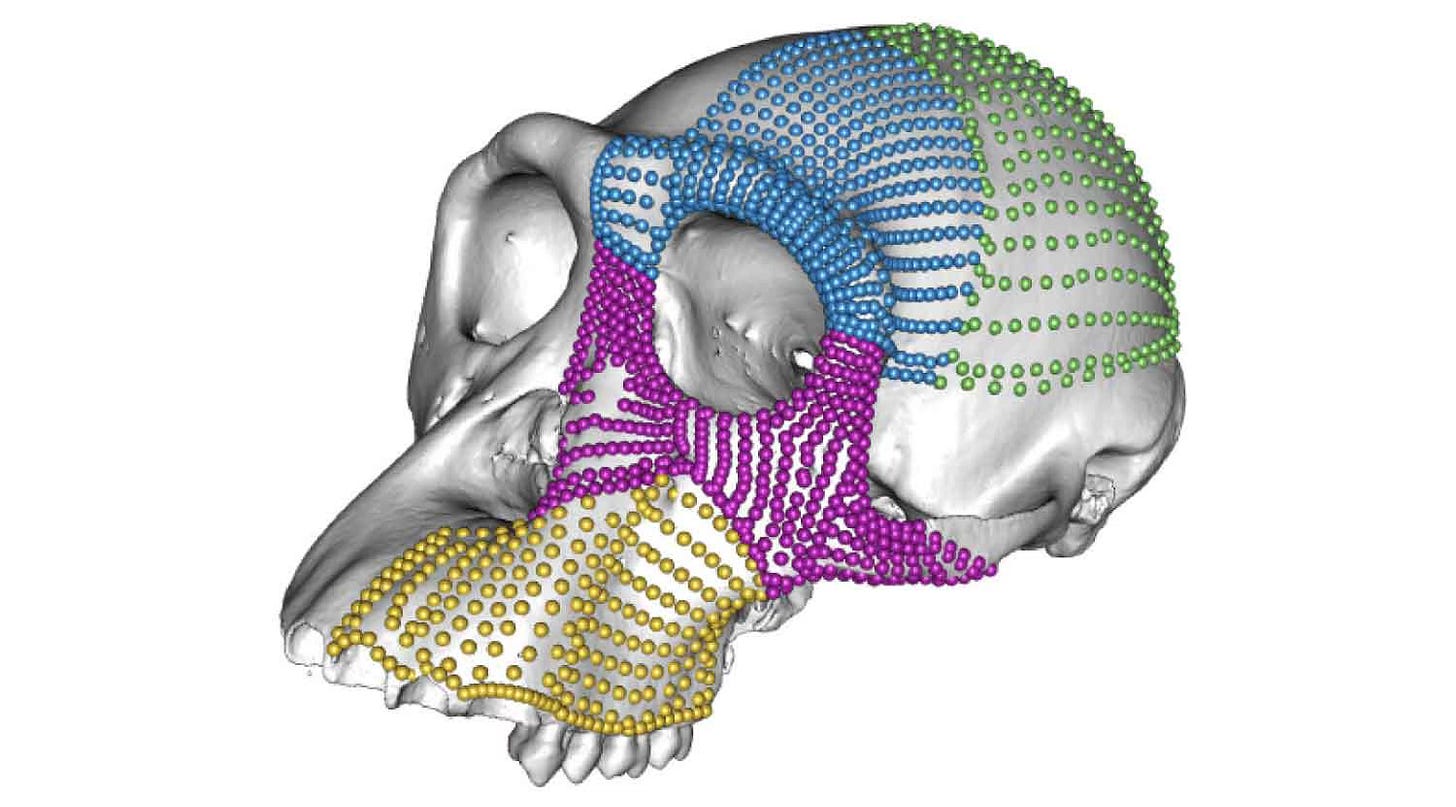
In the study by Gómez-Robles and coworkers, the team recorded landmarks on four different parts of the skull, amounting to more than 1400 landmarks on each of nearly 300 individuals. Many of these landmarks were placed automatically by dividing up the surface of each skull in software, enabling fine comparisons of the surfaces.
Individuals in biology are a tightly limited set of anatomical forms within the universe that might be imagined. Forms are similar because of the shared ancestry of species and because stabilizing selection limits what changes are possible. For these reasons, the hundreds of landmarks that a researcher may record on any single bone are never independent of each other; the position of each landmark covaries with the position of nearby landmarks.
Some of the covariation of landmarks relates to how big individuals are. Sometimes better comparisons of shape can be made by rotating, translating, and growing or shrinking the landmarks from each individual to a least-squares fit with all the others. This procedure is called Procrustes transformation, named for the mythological character who forced victims to the size of an iron bed by stretching them or cutting off their legs.
These methods and related ones are known as geometric morphometrics (GM). I use these methods in my lab, as do my students and thousands of other researchers across the anatomical sciences. When the underlying 3D data are freely available, these methods are highly replicable and can be readily extended to new samples.
High-dimensional, highly-correlated data may be straightforward mathematically, but a challenge to imagine. For visualization of such datasets, researchers often apply an approach known as principal components analysis, or PCA for short. PCA is not a statistical test, it is just a different way of looking at high-dimensional data by focusing on covariance between dimensions. PCA works by computing the covariances among dimensions and choosing an axis representing the largest covariance, called the first principal component (PC1), then the next largest (PC2), and so on. In morphological datasets, it’s often the case that the first three or four PCs account for 80% or more of the covariance of the various landmarks across the sample.
Phylogenetic comparative methods
One way of using PCA to illustrate the variation across a group of species is a phylomorphospace plot. In the plot below, the positions of the various hominoid species are determined by their average scores for PC1 (on the x axis) and PC2 (on the y axis). The first two principal components comprise around 81% of the variance in the overall sample (65.44% for PC1 + 16.04% for PC2 = 81.48%).
The tree connecting the species is also represented on the plot. The branches of the tree shown here are not a result of the analysis of morphology, they come from DNA comparisons external to this study.
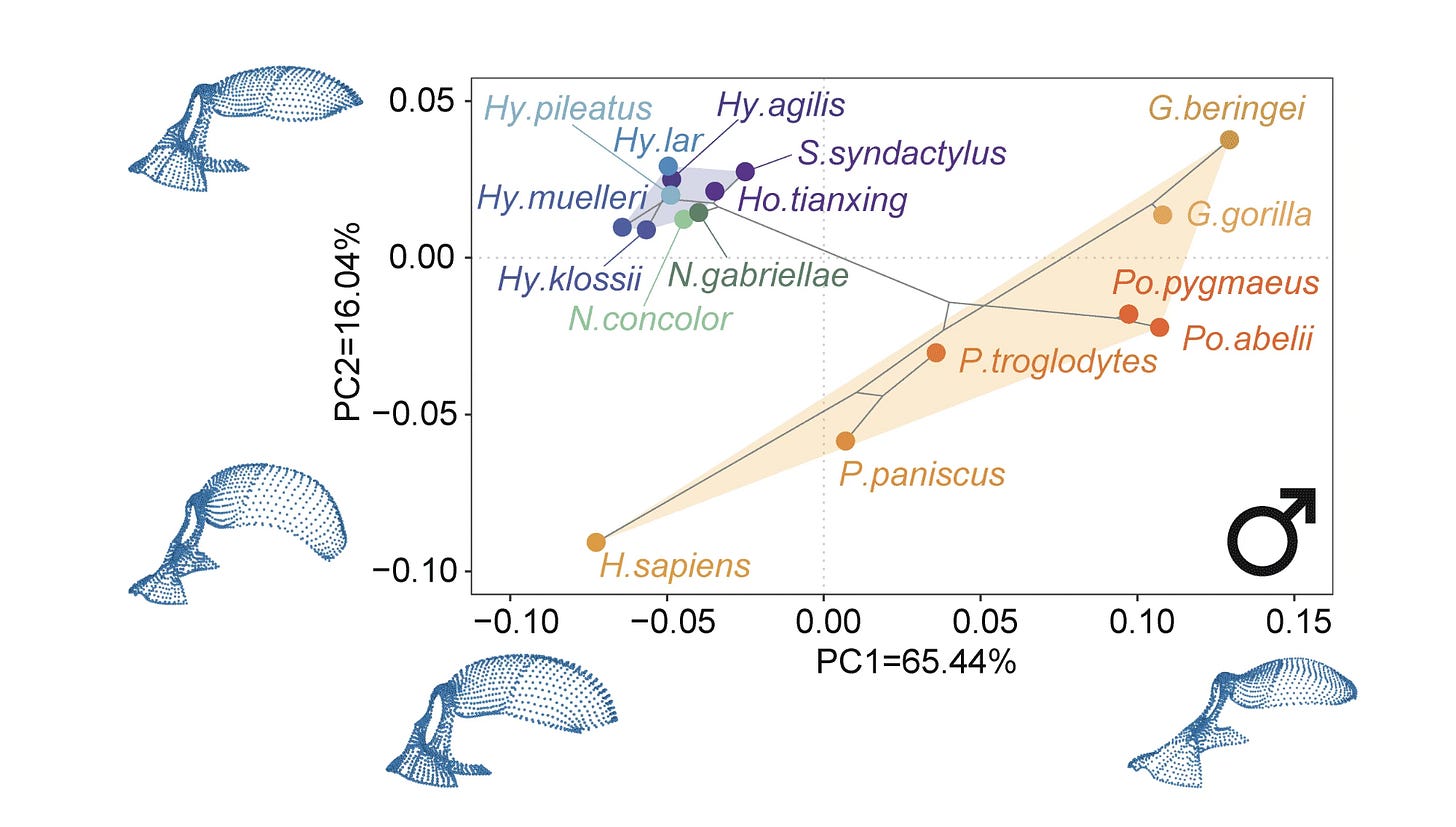
The phylomorphospace plot helps to illustrate that gibbons and siamangs—the hylobatids—all have similar morphological configurations, while great apes and humans have greater morphological diversity. Indeed, very closely-related species of great apes like chimpanzees and bonobos seem to be almost as different from each other as the maximum difference among species of gibbons.
That kind of visual comparison is a good use of PCA. It leads naturally to the hypothesis that gibbons might have had slower evolution of cranial shape than the great apes. But the PCA by itself doesn’t test this hypothesis, because it doesn’t provide an expectation for how much evolution should have happened on any particular branch.
Phylogenetic comparative methods test whether the shape differences among species are compatible with the lengths of branches of the phylogenetic tree. Species may show shape differences out of proportion to the lengths of branches that connect them. When that happens, it may be that the differences in form reflect natural selection on one or more branches. It can still be tricky to evaluate whether a branch has an unexpectedly large or small amount of evolution. A common way of approaching this is to assume that changes are random across all the branches, with evolution by Brownian motion as ancestral species move slightly upward and downward many times. Such a model allows a test of whether each specific branch is a significant outlier either in faster or slower evolution than other branches.
In the study by Gómez-Robles and coworkers, the hypothesis of rate differences in the different branches is tested using a model of Brownian motion. The image below shows the results of this test for the lower face.
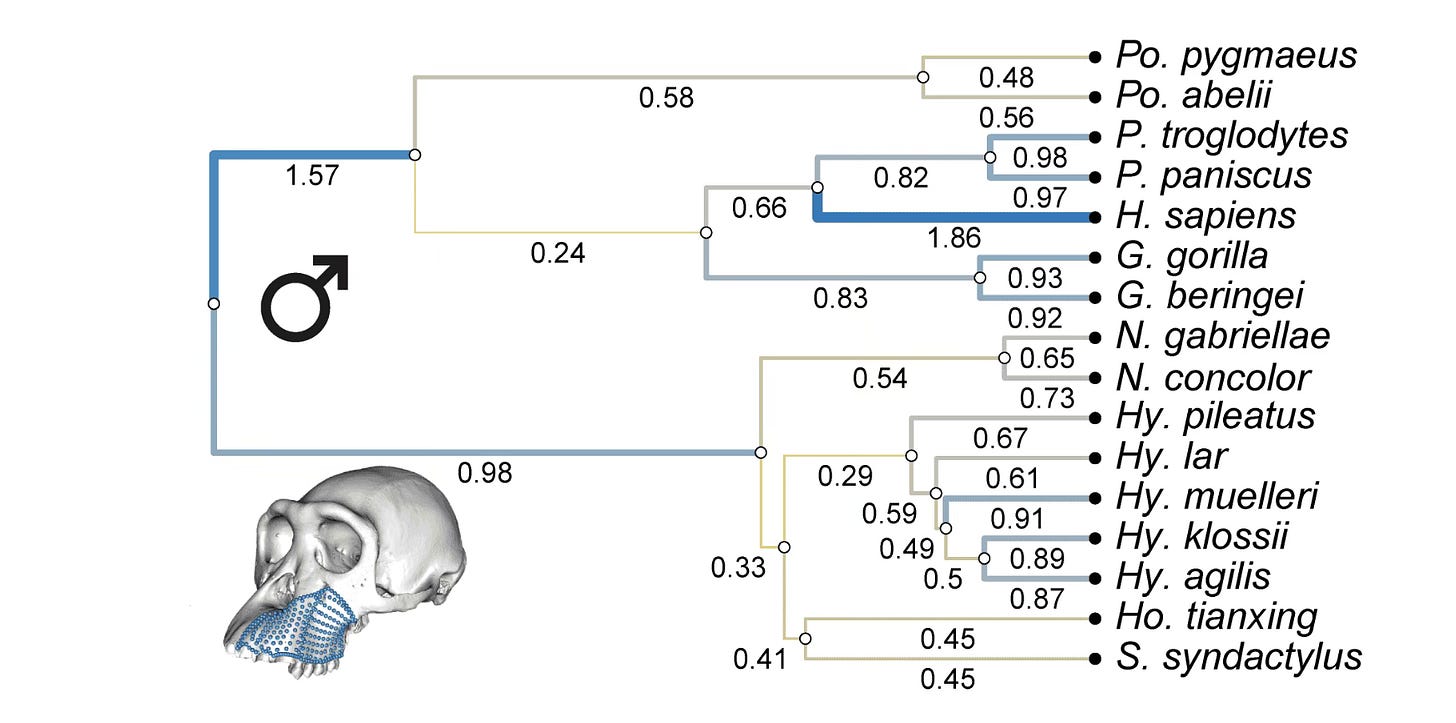
Most branches fit the Brownian motion model. That means that, for the most part, the diversification of the lower face across the apes and humans has been consistent with a fairly slow rate of change, randomized across branches.
But there are exceptions. Some of the shared ancestral branches leading to Hylobates had unusually slow evolutionary rates. So does the branch leading to African apes. In both cases, stabilizing selection may have put the brakes on shape changes in the common ancestors of these species.
At the same time, the branch leading to humans shows a much faster rate of evolution of the lower face than other branches.
It’s not just the lower face. Other comparisons in the study showed the same outcome. Gómez-Robles and coworkers explored this hypothesis by looking at male and female samples separately, and also by doing separate analyses of the different parts of the cranium. All the results were pretty consistent. The human branch evolved faster than others.
Their figure showing the summary of results of shape difference and evolutionary rates in the hominids (great apes and humans) and hylobatids (gibbons and siamangs) is a powerful statement about the slow evolution in gibbons, greater shape variation in great apes, and moderately faster evolutionary rate in great apes.
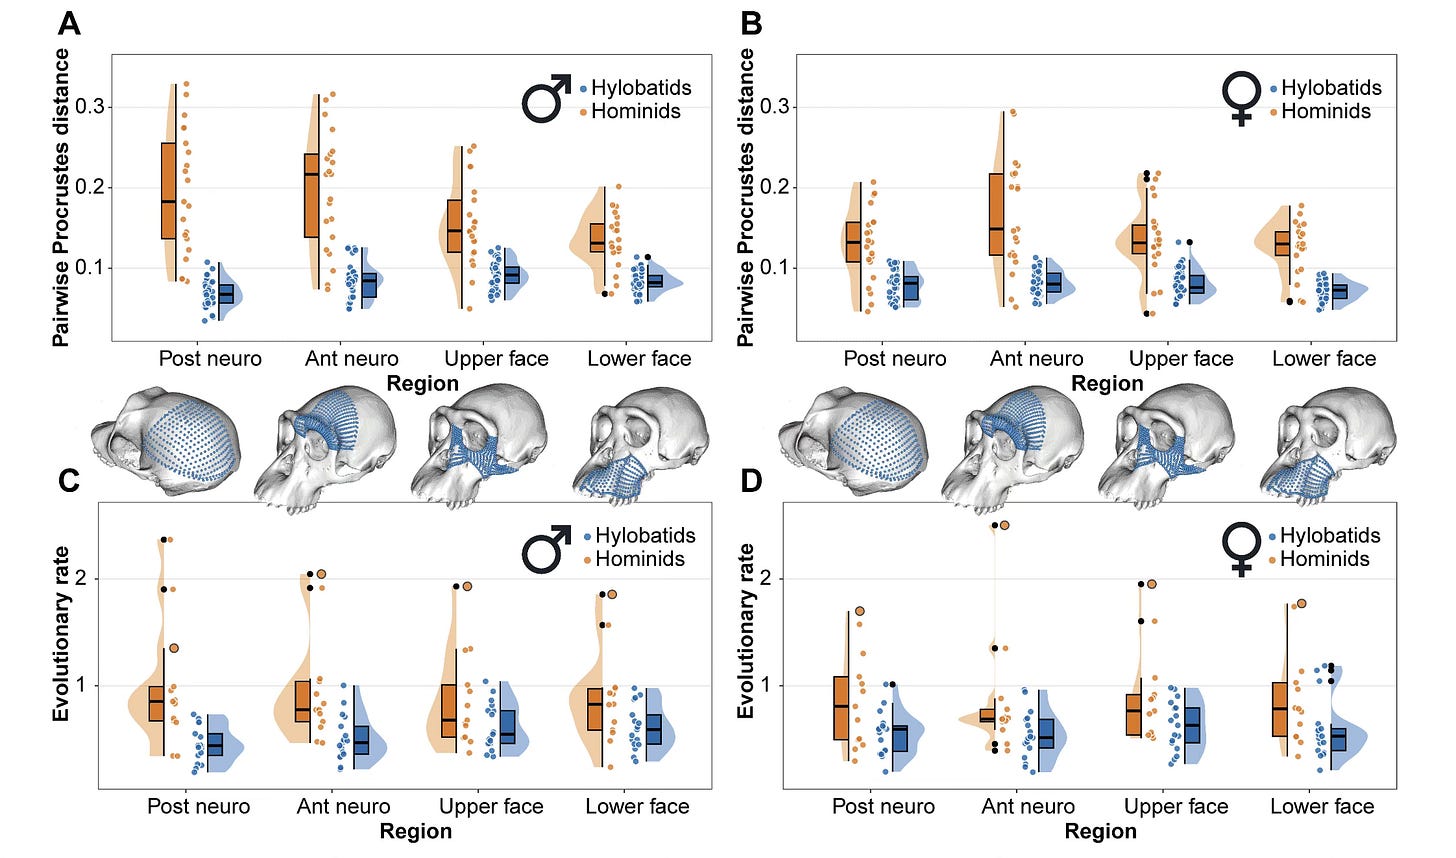
The human branch is consistently a standout in rapid evolutionary rate across nearly all anatomical regions. We evolved skull shape at double or more the rate of our close relatives.
Fossils and shape
This study did not involve fossils or the differences between humans and extinct hominins. That’s not a bad thing. Fossil samples are nonexistent for most of the branches of great apes and hylobatids. Even fossil hominins which have numerous fossils for some species are generally not well-enough preserved to enable this kind of very dense array of semi-landmarks to be collected. Moreover, the tree of relationships of fossil hominins is messy and uncertain. Aside from Neanderthals and Denisovans, it is really not possible to nail down branch lengths well enough to make reliable comparisons of evolutionary rate.
All those are reasons to take a somewhat different approach to shape analysis in fossil hominins.
Still, even without the fossils this study has some clear implications for human origins. Some previous work has noted that fossil hominins are very diverse in anatomical form. It’s a good question how much the greater diversity should matter to how scientists classify the fossils.
For example, in a memorable 2004 study Katarina Harvati, Stephen Frost, and Kieran McNulty looked at the shape difference between modern human and Neanderthal samples. They wanted to understand whether skull differences between Neanderthals and modern humans are more or less than the difference between pairs of great ape and cercopithecoid primate lineages.
The question was one of classification. Should Neanderthals be recognized as a different species from modern people? Or is the difference between them more comparable to subspecies recognized in other kinds of primates?
What Harvati, Frost, and McNulty found was that Neanderthals and modern humans are quite different in the shape configuration of cranial landmarks. That difference was more than any of the within-species groups they examined. The Neanderthal-modern difference actually exceeded many closely-related pairs of primate species. They concluded that Neanderthals should be classified as a different species from modern people.
This study happened before ancient DNA demonstrated ancient interbreeding, which has left modern people with a small fraction of Neanderthal ancestry. Some scientists twenty years ago were trying to use morphology to predict whether such interbreeding would have been possible. People interpreted results showing Neanderthal anatomical difference as evidence for genetic incompatibility.
I remember those results well because my colleagues James Ahern, Sang-Hee Lee, and I looked closely at them in a 2005 paper. One of our conclusions was that the differences among human groups, including the Neanderthals, were consistent with the hypothesis that their differences in skull shape were a simple result of the time since they shared common ancestors. This idea has been supported by quite a lot of subsequent research on skull shape in recent humans and Neanderthals.
The work by Gómez-Robles and coworkers shows that the lineage leading to humans had faster evolution of skull shape. A likely explanation is that the skull shape in humans has been less constrained by stabilizing selection than in many of our primate relatives. If so, the small differences between subspecies and between species of these other primates make a lot of sense, even those that have been diversifying much longer than human populations. Relatively bigger differences between living humans and some ancient groups—including Neanderthals—just mean that human skulls have been evolving with fewer constraints.
References
Ahern, J. C. M., Hawks, J. D., & Lee, S.-H. (2005). Neandertal taxonomy reconsidered…again: A response to Harvati et al. (2004). Journal of Human Evolution, 48(6), 647–652. https://doi.org/10.1016/j.jhevol.2004.10.008
Gómez-Robles, A., Drennan, A., Basa, M., & Gleeson, A. (2025). Accelerated evolution increased craniofacial divergence between humans and great apes. Proceedings of the Royal Society B: Biological Sciences, 292(2057), 20251507. https://doi.org/10.1098/rspb.2025.1507
Harvati, K., Frost, S. R., & McNulty, K. P. (2004). Neanderthal taxonomy reconsidered: Implications of 3D primate models of intra- and interspecific differences. Proceedings of the National Academy of Sciences, 101(5), 1147–1152. https://doi.org/10.1073/pnas.0308085100

